Tuesday 22 August 2023

CB DATA MANAGEMENT STRATEGIES

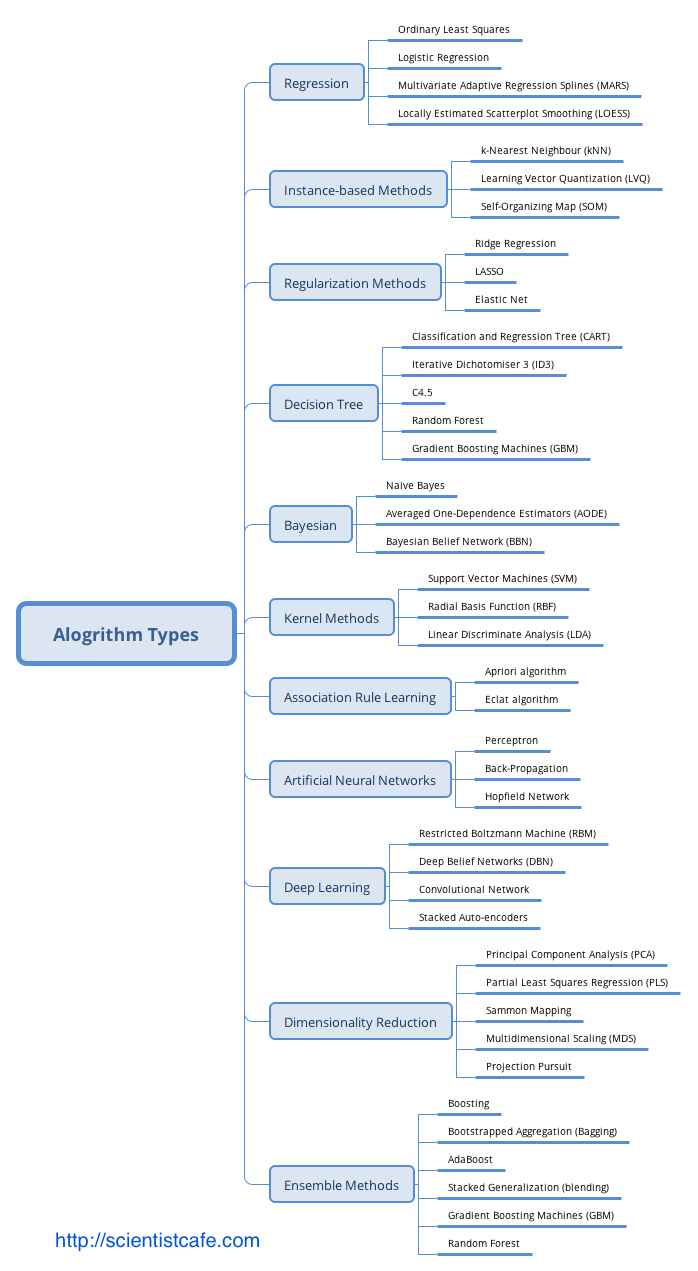
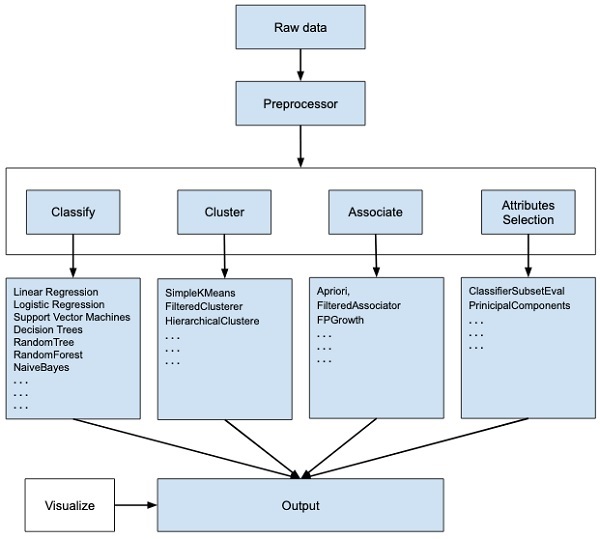
TÜRKİYE CUMHURİYET MERKEZ BANKASI VERİ YÖNETİMİ STRATEJİLERİ RAPORU HAZIRLAYAN MURAT ÇAKIR   Yönetici Özeti: Merkez Bankası Veri Yönetimi Stratejileri Raporu Sayın Başkanım, Bu yönetici özeti, Türkiye Cumhuriyet Merkez Bankası için hazırlanan Veri Yönetimi Stratejileri Raporu'ndaki önemli noktaları vurgulamaktadır. Söz konusu raporun amacı, Merkez Bankasının fiyat ve finansal istikrarı koruma misyonunu güçlendirmek amacıyla verilerin etkin bir şekilde yönetilmesi, analizi ve kullanımı için gerekli çerçeveyi oluşturmaktır. Halihazırdaki durumun değerlendirildiği rapor ayrıca sunulacaktır. Arka Plan ve Amaç: Verinin giderek artan önemi ve içinde bulunduğumuz dijital dönüşüm çağında, verilerin stratejik bir varlık olarak kullanılmasının önemi ve gerekliliği açıktır. Veri Yönetimi Stratejileri Raporu, bankanın bilgiye dayalı ve veri odaklı karar alma süreçlerini desteklemeyi ve veri analitiği alanı ve bilişim teknolojilerindeki en son yeniliklerin kurum içinde hayat geçirilmesini teşvik etmeyi amaçlamaktadır. Ana Başlıklar: Rapor, aşağıdaki ana başlıklara odaklanmaktadır: 1. Veri Yönetişimi: Veri yönetimi politikaları geliştirme, veri sorumluluğu tanımlama ve Veri Yönetişim Kurulu oluşturulmasıyla veri yönetişiminin sağlanması, 2. Veri Toplama ve Entegrasyon: Tüm veri kaynaklarının tanımlanması, veri toplama prosedürlerinin belirlenmesi ve yüksek veri kalitesi güvencesinin sağlanması, 3. Veri Analitiği ve İçgörüler: Gelişmiş öngörü modelleri inşası için ileri düzey analitik tekniklerin geliştirilmesi ve verinin etkili bir şekilde görselleştirilmesi, 4. Veri Güvenliği ve Gizlilik: Güçlü ve sağlam siber güvenlik önlemlerinin alınması, veri gizliliği uyumunun sağlanması ve erişim kontrollerinin uygulanması, 5. Veri Altyapısı: Modern donanım ve uzaktan erişim (sanal sunucu, iş istasyonu ve kurum dışından erişim için kümeleme ve GPU bilişim) çözümleri kullanarak veri altyapısınının güçlendirilmesi ve 6. Kapasite Geliştirme: Eğitim ve iş birliği fırsatları aracılığıyla çalışanların veri analitiği ve yönetimi konusundaki yetkinliklerinin geliştirilmesi ve/veya artırılması hedeflenmektedir. 7. Uygulama Yol Haritası: Kısa, orta ve uzun vadeli hedefler belirlenmiş olup, bu hedeflerin nasıl gerçekleştirileceği adım adım açıklanmaktadır. Sonuç: Veri Yönetimi Stratejileri Raporu, Türkiye Cumhuriyet Merkez Bankası’nın misyonunu daha etkili bir şekilde yerine getirebilmesi için verinin kamuoyunun bilgilendirilmesi ve karar alım süreçlerinde stratejik bir araç olarak kullanılmasına yönelik tasarım, uygulama ve yönetim çalışma ve çabalarının çerçevesini sunmaktadır. Kurumun veri stratejilerinin başarılı bir şekilde uygulanması ile veri analitiği alanı ve bilişim teknolojilerindeki en son yenilikler hayata geçirilecek, böylece karar alma süreçlerinin güçlendirilmesi ile ekonomik ve finansal istikrarı sağlama misyonu en optimal şekilde yerine getirilebilecektir. Saygılarımla bilgilerinize sunarım, Murat Çakır   Merkez Bankası Veri Yönetimi Stratejileri Raporu Yönetici Özeti Veri Yönetimi Stratejileri Raporu, Türkiye Cumhuriyet Merkez Bankası bünyesinde sağlam bir veri stratejisi uygulamanın amaç ve gerekleri ile bu stratejinin çerçeve taslağını sunmaktadır. Merkez bankalarında veriyi kullanma ile bilgiye dayalı ve veri odaklı karar almanın önemi, diğer tüm iktisadi karar alıcılarda da olması gerektiği gibi, misyonlarının etkili bir şekilde yerine getirebilmesi için gitgide yükselen bir hızla artmaktadır. Bu bağlamda, Merkez Bankası Veri Yönetimi Stratejileri Raporu, veri yönetişimi, veri yönetimi ve veri kullanımı için kapsamlı bir çerçeve oluşturmayı amaçlamaktadır. Halihazırdaki durumun değerlendirildiği rapor ayrıca sunulacaktır. İçindekiler Giriş 1.1 Arka Plan 1.2 Veri Stratejisinin Amacı Veri Yönetişimi 2.1 Yönetişim Yapısı 2.2 Veri Yönetişim Politikaları 2.3 Veri Sorumluluğu Veri Toplama ve Entegrasyon 3.1 Veri Kaynakları 3.2 Veri Toplama Prosedürleri 3.3 Veri Entegrasyonu ve Kalite Güvencesi Veri Analitiği ve İçgörüler 4.1 Gelişmiş Analiz Altyapısı 4.2 Öngörü Modelleme 4.3 Veri Görselleştirme Veri Güvenliği ve Gizlilik 5.1 Siber Güvenlik Önlemleri 5.2 Veri Gizliliği Uyumu 5.3 Erişim Kontrolü Veri Altyapısı 6.1 Donanım ve Yazılım 6.2 Uzaktan Erişim 6.3 Veri Depolama Kapasite Geliştirme 7.1 Eğitim ve Yetenek Geliştirme 7.2 İşe Alma Stratejileri 7.3 Eğitim Kurumlarıyla İş Birliği Veri Stratejisi Uygulama Yol Haritası 8.1 Kısa Vadeli Hedefler 8.2 Orta Vadeli Hedefler 8.3 Uzun Vadeli Hedefler İzleme ve Değerlendirme 9.1 Anahtar Performans Göstergeleri (KPI'lar) 9.2 Düzenli Denetimler ve İncelemeler 10. Sonuç 11. Uygulama Yol Haritası 12. Sözlük 14. Ekler   1. Giriş 1.1 Arka Plan Türkiye Cumhuriyet Merkez Bankası, kanunuyla kendisine verilen görevleri etkili bir şekilde yerine getirebilmek için, veriyi stratejik bir varlık olarak kullanma ve bilgiye dayalı ve veri odaklı karar almanın öneminin bilinciyle çok uzun yıllardır ilgili alanlarda gereken çalışmaları yerine getirmiş ve gerekli yatırımları yapmıştır. Bu yönüyle, ülkemizdeki en erken dijitalleşme çalışmalarının yürütülmesi, ulusal ve uluslararası eşgüdüm ve işbirliği çerçevesinde çeşitli çalışmalarında yer alınan kurullar ve ortak yürütülen projelerdeki faaliyetler, veri üretimi ve paylaşımı, ve benzeri bir çok konuda öncü olmuştur. Kurum içinde gerçekleştirilen çalışma ve projelerin önemli bir bölümü de ya dünya çapında ilk ya da benzer örneklerinin ötesinde olma özelliği taşımaktadır . TCMB’nin, aynı bilinçle yeni bir bakış açısı ve enerjiyle her konuda olduğu gibi veri süreçlerinde de çağın gereklerini yakalaması ve öncü rolü üstlenmesi gerekliliği açıktır. Bu bağlamda, Veri Yönetimi Stratejileri Raporu ile verinin etkili bir şekilde yönetilmesi, güvenliğinin sağlanması ve tam potansiyeliyle kullanılmasını sağlayan bir çerçeve oluşturulması amaçlanmıştır. 1.2 Veri Stratejisinin Amacı Veri Stratejisinin temel amacı: • Bilinçli karar alma için verinin kalitesini ve erişilebilirliğini artırmak, • Veri yönetişimi için sağlam bir yapı oluşturarak uyum ve veri bütünlüğünü sağlamak, • İleri düzeyde analitik yöntemlerin kullanımını hayata geçirerek para politikasını, finansal düzenlemeleri ve ekonomik araştırmaları desteklemek, • Veriyi siber güvenlik önlemleri ve gizlilik uyumlarıyla korumak, • Sürdürülebilir bir veri altyapısı oluşturmak ve • Çalışanların veriyi etkili bir şekilde yönetme ve analiz etme yeteneklerini geliştirmek olarak özetlenebilir. 2. Veri Yönetişimi 2.1 Yönetişim Yapısı Bankanın veri ile ilintili politikalarını, prosedürlerini ve uyumunu denetlemek üzere özel bir Veri Yönetişim Kurulu oluşturulacaktır. Bu kurul, çeşitli birimlerden temsilciler içerecek ve veri politikalarının Merkez Bankasının stratejik hedefleriyle uyumunu sağlayacaktır. 2.2 Veri Yönetişim Politikaları Güçlü ve sağlam veri yönetişimi politikaları oluşturulacak ve uygulamaya konacak, böylece veri işleme, sınıflandırma, depolama ve paylaşma süreçleri yönetilecektir. Bu politikalar, veri saklama, arşivleme ve imha politikalarını da içermektedir. 2.3 Veri Sorumluluğu Her bir birim içinde veri sorumluları belirlenerek veri kalitesi, doğruluğu ve uyum için sorumluluk ve hesap verebilirlik sağlanacaktır. Veri sorumluları, Veri Yönetişim Kurulu ile yakın iş birliği ve eşgüdüm içinde çalışacaklardır.   3. Veri Toplama ve Entegrasyon 3.1 Veri Kaynakları Tüm veri kaynakları, iç ve dış ve yapılandırılmış ve yapılandırılmamış olmak üzere belirlenecek ve kataloglanacaktır. Veri kaynakları iyi belgelenmeli ve erişilebilir olmalıdır. 3.2 Veri Toplama Prosedürleri Veri toplama için standartlaştırılmış prosedürler belirlenecek ve böylece veri tutarlılığı, doğruluğu ve verilerin zamanında toplanması sağlanacaktır. Bu, gerçek zamanlı veri akışları ve düzenli veri yenileme döngülerini de içermektedir. 3.3 Veri Entegrasyonu ve Kalite Güvencesi Veri entegrasyon teknolojilerinin uygulanması ve düzenli veri kalite değerlendirmeleri ile, tutarsızlıkların ve anormalliklerin belirlenmesi ve düzeltmesi kolaylaşacaktır. 4. Veri Analitiği ve İçgörüler 4.1 Gelişmiş Analiz Altyapısı Veri Madenciliği, makine öğrenmesi ve yapay zekâ gibi gelişmiş analiz tekniklerini kullanarak veriden değerli bilgiler çıkarmak amaçlanmaktadır. Merkez bankacılığı özgül veri işleme ve modelleme ihtiyaçları bağlamında buna öngörü modellemesi, duygu analizi ve anormallik tespiti gibi analiz yöntemleri dahil edilebilir. 4.2 Öngörü Modellemesi Ekonomik trendlerin tahmini, risk değerlendirme ve para politikası kararlarının veri ve bilgi ile desteklenmesi için öngörü modelleri geliştirilmesi amaçlanmaktadır. Bu modeller, yeni veri ve içgörülere göre sürekli olarak iyileştirilecektir. 4.3 Veri Görselleştirme Karmaşık veriyi anlaşılır ve işlenebilir bir biçimde sunmak için veri görselleştirme araçlarının uygulanması amaçlanmaktadır. Tasarlanacak etkileşimli panolar aracılığıyla, paydaşların veriyi bağımsız olarak derinlemesine keşfetmeleri, incelemeleri, düzenlemeleri ve analizlerde kullanmaları sağlanacaktır. 5. Veri Güvenliği ve Gizlilik 5.1 Siber Güvenlik Önlemleri Veriyi ihlallerden ve yetkisiz erişimden korumak için sağlam siber güvenlik önlemleri uygulamak amaçlanmaktadır. Sistemsel ve yapısal zayıflıkları belirlemek için düzenli güvenlik denetimleri ve penetrasyon testleri gerçekleştirilecektir. 5.2 Veri Gizliliği Uyumu Kişisel ve hassas bilgilerin korunması için veri gizliliği düzenlemeleri ve standartlarına uyum sağlanması amaçlanmaktadır. 5.3 Erişim Kontrolü Rollere ve sorumluluklara dayalı olarak veri erişimini sınırlamak için sıkı erişim kontrolleri uygulanacaktır. Yetkisiz veri kullanımını önlemek için erişim kayıtları düzenli olarak izlenecek, raporlanacak ve paydaşlara geri bildirimde bulunulacaktır. 6. Veri Altyapısı 6.1 Donanım ve Yazılım Verimli bir şekilde veri işleme, depolama ve analizlerini desteklemek için modern donanım ve yazılım çözümlerine yatırım yapılması öngörülmektedir.   6.2 Uzaktan Erişim Kümeleme ve GPU bilişim sistemleri araştırılarak uzaktan erişimde gerekli olan, işlem gücü, depolama, saklama ve güvenlik hizmetlerinin ölçeklendirilmesi, yönetimi ve en verimli bir şekilde sunulması amaçlanmaktadır. 6.3 Veri Depolama Veri saklama politikalarına uygun olacak şekilde, yapılandırılmış ve yapılandırılmamış verileri barındıran güvenli ve yedekli bir veri depolama çözümü hayata geçirilecektir. 7. Kapasite Geliştirme 7.1 Eğitim ve Yetenek Geliştirme Çalışanları veri analitiği ve analizi, veri madenciliği ve makine öğrenmesi ile veri yönetimi konularında eğitmek ve bu konulardaki en iyi uygulamalar temel olmak üzere geliştirmek için düzenli eğitim programları sunulması amaçlanmaktadır. 7.2 İşe Alma Stratejileri Veri uzmanları ve analistler işe alınarak Merkez Bankasının veri yeteneklerinin artırılması amaçlanmaktadır. 7.3 Eğitim Kurumlarıyla İşbirliği Üniversiteler ve araştırma kurumlarıyla işbirliği yaparak veri bilimi ve analitiği alanındaki bilgi, deneyim ve yeteneklerin ve akademik uzmanlığın kullanılması amaçlanmaktadır. 8. Veri Stratejileri Uygulama Yol Haritası 8.1 Kısa Vadeli Hedefler Veri Yönetişim Kurulu'nu kurmak ve veri Yönetişim politikalarının taslağını oluşturmak. Temel veri analitiğini başlatmak için veriyi tanımlamak ve kataloglamak. Temel veri analitiğini başlatmak. 8.2 Orta Vadeli Hedefler Ekonomik tahminler için gelişmiş analitik modeller geliştirmek ve uygulamak. Veri güvenliği önlemlerini güçlendirmek ve siber güvenlik denetimine tabi tutmak. İç paydaşlar için gelişmiş veri görselleştirme araçlarını uygulamak. 8.3 Uzun Vadeli Hedefler Veri yönetimi için olgun ve kapsamlı bir çerçeve oluşturmak. Merkez Bankası içinde veri analitiği için bir mükemmeliyet merkezi kurmak. Teknolojik gelişmelerle uyumlu kalmak için veri stratejilerini sürekli olarak yenilikçi hale getirmek. 9. İzleme ve Değerlendirme 9.1 Anahtar Performans Göstergeleri (APG) Veri stratejilerinin etkililiğini ve verimliliğini ölçmek için veri doğruluğu, işleme hızı ve veri odaklı kararların Merkez Bankasının hedefleri üzerindeki etkisi gibi anahtar performans göstergeleri belirlenecektir. 9.2 Denetim ve İnceleme Veri yönetimi politikalarına, güvenlik önlemlerine ve stratejik hedeflere uyumu denetlemek için düzenli denetim ve incelemeler yapılacaktır. 10. Sonuç Veri Yönetim Stratejileri Raporu, Türkiye Cumhuriyet Merkez Bankası'nın temel görevlerini etkili bir şekilde yerine getirebilmesi için verinin yönetimi, analizi ve kullanımını sağlamak üzere bir çerçeve oluşturmayı amaçlamaktadır. Bu stratejilerin benimsenmesiyle Merkez Bankası, ekonomik ve finansal istikrarı artırmayı, bilinçli karar alma süreçlerini desteklemeyi ve veriye dayalı bilgilerle inovasyonu teşvik etmeyi hedeflemektedir. Daha ayrıntılı uygulama planları ve zamanlamalar için lütfen eklenen uygulama yol haritasına başvurunuz. 11. Uygulama Yol Haritası 1. Yıl: (Kısa Vade) Veri Yönetişim Kurulu'nu kurulması ve veri sorumlularının atanması, Temel veri yönetimi politikalarının geliştirilmesi ve uygulanması, Temel veri kaynaklarını belirlenmesi ve kataloglanması, Veri kalitesi değerlendirmeleri, Ekonomik tahminler için gelişmiş analitik modellerin geliştirilmesi ve uygulanması, Veri güvenliği önlemlerinin güçlendirilmesi ve siber güvenlik denetimleri, İç paydaşlar için veri görselleştirme araçlarının uygulanması, Veri analitiği becerilerinin geliştirmek için kapasite geliştirme programlarının başlatılması, Deneyimlerden yola çıkarak veri yönetimi politikalarının geliştirilmesi ve genişletilmesi, İç ve dış paydaşlar için gelişmiş veri görselleştirme araçlarının uygulanması, Kapasite geliştirme çabalarının sürdürülmesi ve yetenek gelişim süreçlerinin değerlendirilmesi ve Veri bilimi ve analitiği konularında üniversitelerle işbirliği fırsatlarının araştırılması. 2. Yıl: (Orta Vade) Merkez bankası içinde veri analitiği için bir mükemmeliyet merkezinin oluşturulması, Finansal düzenlemelerde risk değerlendirmesi için öngörü modellemelerinin uygulanması, Endüstri en iyi uygulamalara dayalı olarak siber güvenlik önlemlerinin düzenli olarak güncellenmesi ve Veri Stratejilerinin etkililiğinin değerlendirilmesi ve gerektiğinde ayarlamalar yapılması. 3. Yıl ve Sonrası: (Uzun Vade) Teknolojik gelişmelere uyum sağlamak için veri stratejilerinin sürekli olarak yenilikçi hale getirilmesi, Merkez Bankası içinde veriye dayalı karar alma kültürünün teşvik edilmesi, Temel görevlerin ötesinde daha geniş politika insiyatiflerinde veriyi kullanma fırsatlarının araştırılması ve Veri girişimleri konusunda diğer merkez bankaları ve finansal kuruluşlarla işbirliği fırsatlarının değerlendirilmesi   12. Sözlük Veri Yönetişim: Veri varlıklarını yönetme, veri kalitesini güvence altına alma, güvenliği sağlama ve uyum sağlama süreçleri. Veri Sorumluluğu: Bir organizasyon içinde veriyi doğruluk, bütünlük ve uygun kullanım açısından yönetme uygulaması. Öngörü Modellemesi: Gelecekteki sonuçları veya davranışları tahmin etmek için geçmiş verileri kullanma süreci. Veri Görselleştirme: Karmaşık veriyi anlamak ve içgörüler elde etmek için grafiksel veya görsel formatlarda sunma işlemi. Siber Güvenlik: Bilgisayar sistemlerini, ağları ve verileri hırsızlığa, zarara veya yetkisiz erişime karşı koruma uygulaması. Veri Gizliliği: Kişisel ve hassas bilgileri yetkisiz erişime ve kullanıma karşı koruma işlemi. Erişim Kontrolü: Bir organizasyon içinde belirli kaynaklara veya bilgilere kimlerin erişebileceğini düzenleme süreci. Anahtar Performans Göstergeleri (APG): Bir organizasyonun hedeflerine ulaşma derecesini değerlendirmek için kullanılan nicel ölçümler. 13. İletişim Bilgileri Veri Yönetimi Stratejileri Raporu ile ilgili sorularınız için lütfen iletişime geçiniz Murat Çakır Uzman Yapısal Ekonomik Araştırmalar Genel Müdürlüğü murat.cakir@tcmb.gov.tr 02167738035 14. Ekler Murat Çakır 2017, ‘A conceptual design of "What and How Should a Proper Macro-Prudential Policy Framework Be?" A Globalistic Approach to Systemic Risk and Procuring The Data Needed,’ IFC Bulletins chapters, in: Bank for International Settlements (ed.), Uses of Central Balance Sheet Data Offices' Information, Volume 45, 2017, Bank for International Settlements (https://www.bis.org/ifc/publ/ifcb45d.pdf) Murat Çakır 2016 ‘National Data Centre and Financial Statistics Office: A Conceptual Design for Public Data Management’, Paper 2016 (https://mpra.ub.uni-muenchen.de/74410/9/MPRA_paper_74410.pdf) Murat Çakır 2014, ‘From Data to Information and from Information to Policy Making - The Story of the "Integrated Company and Industry Analysis Platform",’ IFC Bulletins Chapters, in: Bank for International Settlements (ed.), Proceedings of the Porto Workshop on "Integrated Management of Micro-Databases", volume 37, 2014, pages 171-178, Bank for International Settlements (http://www.bis.org/ifc/publ/ifcb37zm.pdf) ‘CBRT Statistics, Data and Database Management Manual’ Başkan yrdlarına mail metni Sayın Başkanım, Türkiye Cumhuriyet Merkez Bankası, kanunuyla kendisine verilen görevleri etkili bir şekilde yerine getirebilmek için, veriyi stratejik bir varlık olarak kullanma ve bilgiye dayalı ve veri odaklı karar almanın öneminin bilinciyle çok uzun yıllardır ilgili alanlarda gereken çalışmaları yerine getirmiş ve gerekli yatırımları yapmıştır. Bu yönüyle, ülkemizdeki en erken dijitalleşme çalışmalarının yürütülmesi, ulusal ve uluslararası eşgüdüm ve işbirliği çerçevesinde çeşitli çalışmalarında yer alınan kurullar ve ortak yürütülen projelerdeki faaliyetler, veri üretimi ve paylaşımı, ve benzeri bir çok konuda öncü olmuştur. Kurum içinde gerçekleştirilen çalışma ve projelerin önemli bir bölümü de ya dünya çapında ilk ya da benzer örneklerinin ötesinde olma özelliği taşımaktadır. Bir süredir, TCMB'nin veri ve bilişim sistemleri ile ilgili yönetsel bazı zafiyetlerin geliştiği, bu alanlardaki sorunların hem iç kullanıcılar hem de kamuoyu açısından riskler oluşturduğu gözlemlenmektedir. Kurum içinde veri üreten ve kullanan birimlerin BTGM ile eşgüdüm içerisinde bahsi geçen alanlar ve barındırdıkları sorunlara ilişkin çalışmaları ve çözüm üretmeleri öncelikli bir konu durumuna gelmiştir. Bu önceliğin ivedilikle yerine getirilmesi ile kurumun işleyişinin sürdürülebilir kılınması yanında TCMB'nin kamuoyunu aydınlatma görev ve sorumluluğunun sağlanması da mümkün olacaktır. TCMB’nin, veri ve kullanımının önemine dair sorumluluk bilinci çerçevesinde, yeni bir bakış açısı ve enerjiyle her konuda olduğu gibi veri süreçlerinde de çağın gereklerini yakalaması ve öncü rolü üstlenmesi gerekliliği açıktır. Bu bağlamda, hazırladığım ve ekte sunulan Veri Yönetimi Stratejileri Raporu ile verinin etkili bir şekilde yönetilmesi, güvenliğinin sağlanması ve tam potansiyeliyle kullanılmasını sağlayan bir çerçeve oluşturulması amaçlanmıştır. Halihazırdaki durumun değerlendirildiği bir rapor talep etmeniz halinde birimlerle iletişime geçilmek suretiyle hazırlanacak ve ayrıca sunulacaktır. Bilgilerinize arz ederim İyi çalışmalar 


Thursday 23 March 2023

Looker Studio Test


 Looker Test 1


https://lookerstudio.google.com/embed/reporting/7ab0e928-e0fe-4d2f-bcc3-ccd7f81c6ab5/page/p_q0lcra3n3c


 Looker Test 2

https://lookerstudio.google.com/embed/reporting/cd5e46aa-44b4-4ccf-94e0-d38250a561c1/page/p_z7jjsvxg4c

Friday 12 August 2022

TYPES OF MACHINE LEARNING ALGORITHMS

 Home Blog Book Learning About Me Non-technical Buy me a coffee

Hui Lin

Follow me on Twitter

Github

2017-07-08

TYPES OF MACHINE LEARNING ALGORITHMs

The categorization here is based on the structure (such as tree model, Regularization Methods) or type of question to answer (such as regression).The summary of various algorithms for data science in this section is based on Jason Brownlee’s blog “(A Tour of Machine Learning Algorithms)[http://machinelearningmastery.com/a-tour-of-machine-learning-algorithms/].” I added and subtracted some algorithms in each category and gave additional comments. It is far less than perfect but will help to show a bigger map of different algorithms. Some can be legitimately classified into multiple categories, such as support vector machine (SVM) can be a classifier, and can also be used for regression. So you may see other ways of grouping. Also, the following summary does not list all the existing algorithms (there are just too many).

  1. Regression

Regression can refer to the algorithm or a particular type of problem. It is supervised learning. Regression is one of the oldest and most widely used statistical models. It is often called the statistical machine learning method. Standard regression models are:

  • Ordinary Least Squares Regression
  • Logistic Regression
  • Multivariate Adaptive Regression Splines (MARS)
  • Locally Estimated Scatterplot Smoothing (LOESS)

The least squares regression and logistic regression are traditional statistical models. Both of them are highly interpretable. MARS is similar to neural networks and partial least squares (PLS) in the respect that they all use surrogate features instead of original predictors.

They differ in how to create the surrogate features. PLS and neural networks use linear combinations of the original predictors as surrogate features ^[To be clear on neural networks, the linear combinations of predictors are put through non-linear activation functions, deeper neural networks have many layers of non-linear transformation]. MARS creates two contrasted versions of a predictor by a truncation point. And LOESS is a non-parametric model, usually only used in visualization.

  1. Similarity-based Algorithms

This type of model is based on a similarity measure. There are three main steps: (1) compare the new sample with the existing ones; (2) search for the closest sample; (3) and let the response of the nearest sample be used as the prediction.

  • K-Nearest Neighbour [KNN]
  • Learning Vector Quantization [LVQ]
  • Self-Organizing Map [SOM]

The biggest advantage of this type of model is that they are intuitive. K-Nearest Neighbour is generally the most popular algorithm in this set. The other two are less common. The key to similarity-based algorithms is to find an appropriate distance metric for your data.

  1. Feature Selection Algorithms

The primary purpose of feature selection is to exclude non-information or redundant variables and also reduce dimension. Although it is possible that all the independent variables are significant for explaining the response. But more often, the response is only related to a portion of the predictors. We will expand the feature selection in detail later.

  • Filter method
  • Wrapper method
  • Embedded method

Filter method focuses on the relationship between a single feature and a target variable. It evaluates each feature (or an independent variable) before modeling and selects “important” variables.

Wrapper method removes the variable according to particular law and finds the feature combination that optimizes the model fitting by evaluating a set of feature combinations. In essence, it is a searching algorithm.

Embedding method is part of the machine learning model. Some model has built-in variable selection function such as lasso, and decision tree.

  1. Regularization Method

This method itself is not a complete model, but rather an add-on to other models (such as regression models). It appends a penalty function on the criteria used by the original model to estimate the variables (such as likelihood function or the sum of squared error). In this way, it penalizes model complexity and contracts the model parameters. That is why people call them “shrinkage method.” This approach is advantageous in practice.

  • Ridge Regression
  • Least Absolute Shrinkage and Selection Operator (LASSO)
  • Elastic Net
  1. Decision Tree

Decision trees are no doubt one of the most popular machine learning algorithms. Thanks to all kinds of software, implementation is a no-brainer which requires nearly zero understanding of the mechanism. The followings are some of the common trees:

  • Classification and Regression Tree (CART)
  • Iterative Dichotomiser 3 (ID3)
  • C4.5
  • Random Forest
  • Gradient Boosting Machines (GBM)
  1. Bayesian Models

People usually confuse Bayes theorem with Bayesian models. Bayes theorem is an implication of probability theory which gives Bayesian data analysis its name.

The actual Bayesian model is not identical to Bayes theorem. Given a likelihood, parameters to estimate, and a prior for each parameter, a Bayesian model treats the estimates as a purely logical consequence of those assumptions. The resulting estimates are the posterior distribution which is the relative plausibility of different parameter values, conditional on the observations. The Bayesian model here is not strictly in the sense of Bayesian but rather model using Bayes theorem.

  • Naïve Bayes
  • Averaged One-Dependence Estimators (AODE)
  • Bayesian Belief Network (BBN)
  1. Kernel Methods

The most common kernel method is the support vector machine (SVM). This type of algorithm maps the input data to a higher order vector space where classification or regression problems are easier to solve.

  • Support Vector Machine (SVM)
  • Radial Basis Function (RBF)
  • Linear Discriminate Analysis (LDA)
  1. Clustering Methods

Like regression, when people mention clustering, sometimes they mean a class of problems, sometimes a class of algorithms. The clustering algorithm usually clusters similar samples to categories in a centroidal or hierarchical manner. The two are the most common clustering methods:

  • K-Means
  • Hierarchical Clustering
  1. Association Rule

The basic idea of an association rule is: when events occur together more often than one would expect from their rates of occurrence, such co-occurrence is an interesting pattern. The most used algorithms are:

  • Apriori algorithm
  • Eclat algorithm
  1. Artificial Neural Network

The term neural network has evolved to encompass a repertoire of models and learning methods. There has been lots of hype around the model family making them seem magical and mysterious. A neural network is a two-stage regression or classification model. The basic idea is that it uses linear combinations of the original predictors as surrogate features, and then the new features are put through non-linear activation functions to get hidden units in the 2nd stage. When there are multiple hidden layers, it is called deep learning, another over hyped term. Among varieties of neural network models, the most widely used “vanilla” net is the single hidden layer back-propagation network.

  • Perceptron Neural Network
  • Back Propagation
  • Hopield Network
  • Self-Organizing Map (SOM)
  • Learning Vector Quantization (LVQ)
  1. Deep Learning

The name is a little misleading. As mentioned before, it is multilayer neural network. It is hyped tremendously especially after AlphaGO defeated Li Shishi at the board game Go. We don’t have too much experience with the application of deep learning and are not in the right position to talk more about it. Here are some of the common algorithms:

  • Restricted Boltzmann Machine (RBN)
  • Deep Belief Networks (DBN)
  • Convolutional Network
  • Stacked Autoencoders
  • Long short-term memory (LSTM)
  1. Dimensionality Reduction

Its purpose is to construct new features that have significant physical or statistical characteristics, such as capturing as much of the variance as possible.

  • Principle Component Analysis (PCA)
  • Partial Least Square Regression (PLS)
  • Multi-Dimensional Scaling (MDS)
  • Exploratory Factor Analysis (EFA)

PCA attempts to find uncorrelated linear combinations of original variables that can explain the variance to the greatest extent possible. EFA also tries to explain as much variance as possible in a lower dimension. MDS maps the observed similarity to a low dimension, such as a two-dimensional plane. Instead of extracting underlying components or latent factors, MDS attempts to find a lower-dimensional map that best preserves all the observed similarities between items. So it needs to define a similarity measure as in clustering methods.

  1. Ensemble Methods

Ensemble method made its debut in the 1990s. The idea is to build a prediction model by combining the strengths of a collection of simpler base models. Bagging, originally proposed by Leo Breiman, is one of the earliest ensemble methods. After that, people developed Random Forest [@Ho1998; @amit1997] and Boosting method [@Valiant1984; @KV1989]. This is a class of powerful and effective algorithms.

  • Bootstrapped Aggregation (Bagging)
  • Random Forest
  • Gradient Boosting Machine (GBM)
Creative Commons License
This work is licensed under a Creative Commons Attribution-NonCommercial-ShareAlike 3.0 Unported License.

Tuesday 9 August 2022

Data Mining vs Data Analysis

Data Mining vs Data Analysis  

data-analyst-interview-questions-and-answers

coursera:data-analyst-interview-questions-and-answers 


15 Data Analyst Interview Questions and Answers

Written by Coursera Staff • Updated on

Enter your data analyst interview with confidence by preparing with these 15 interview questions.

A smiling woman in a wheelchair interviews for a data analyst job with a hiring manager.

If you’re like many people, the job interview can be one of the most intimidating parts of the job search process. But it doesn’t have to be. With some advanced preparation, you can walk into your data analyst interview feeling calm and confident. 

In this article, we’ll review some of the most common interview questions you’ll likely encounter as you apply for an entry-level data analyst position. We’ll walk through what the interviewer is looking for and how best to answer each question. Finally, we’ll cover some tips and best practices for interviewing success. Let’s get started.

General data analyst interview questions

These questions cover data analysis from a high level and are more likely to appear early in an interview. 

1. Tell me about yourself.

What they’re really asking: What makes you the right fit for this job?

This question can sound broad and open-ended, but it’s really about your relationship with data analytics. Keep your answer focused on your journey toward becoming a data analyst. What sparked your interest in the field? What data analyst skills do you bring from previous jobs or coursework?

As you formulate your answer, try to answer these three questions:

  • What excites you about data analysis?

  • What excites you about this role?

  • What makes you the best candidate for the job?

An interviewer might also ask:

  • What made you want to become a data analyst?

  • What brought you here?

  • How would you describe yourself as a data analyst?

2. What do data analysts do?

What they’re really asking: Do you understand the role and its value to the company?

If you’re applying for a job as a data analyst, you likely know the basics of what data analysts do. Go beyond a simple dictionary definition to demonstrate your understanding of the role and its importance.

Outline the main tasks of a data analyst: identify, collect, clean, analyze, and interpret. Talk about how these tasks can lead to better business decisions, and be ready to explain the value of data-driven decision-making.

An interviewer might also ask:

  • What is the process of data analysis?

  • What steps do you take to solve a business problem?

  • What is your process when you start a new project?

    3. What was your most successful/most challenging data analysis project?

    What they’re really asking: What are your strengths and weaknesses?

    When an interviewer asks you this type of question, they’re often looking to evaluate your strengths and weaknesses as a data analyst. How do you overcome challenges, and how do you measure the success of a data project?

    Getting asked about a project you’re proud of is your chance to highlight your skills and strengths. Do this by discussing your role in the project and what made it so successful. As you prepare your answer, take a look at the original job description. See if you can incorporate some of the skills and requirements listed.

    If you get asked the negative version of the question (least successful or most challenging project), be honest as you focus your answer on lessons learned. Identify what went wrong—maybe your data was incomplete or your sample size was too small—and talk about what you’d do differently in the future to correct the error. We’re human, and mistakes are a part of life. What’s important here is your ability to learn from them. 

    An interviewer might also ask:

  • Walk me through your portfolio.

  • What is your greatest strength as a data analyst? How about your greatest weakness?

  • Tell me about a data problem that challenged you.


4. What’s the largest data set you’ve worked with?

What they’re really asking: Can you handle large data sets?

Many businesses have more data at their disposal than ever before. Hiring managers want to know you can work with large, complex data sets. Focus your answer on the size and type of data. How many entries and variables did you work with? What types of data were in the set?

The experience you highlight doesn't have to come from a job. You’ll often have the chance to work with data sets of varying sizes and types as a part of a data analysis course, bootcamp, certificate program, or degree. As you put together a portfolio, you may also complete some independent projects where you find and analyze a data set. All of this is valid material to build your answer. 

An interviewer might also ask:

  • What type of data have you worked with in the past?


Data analysis process questions

The work of a data analyst involves a range of tasks and skills. Interviewers will likely ask questions specific to various parts of the data analysis process to evaluate how well you perform each step.

5. Explain how you would estimate … ?

What they’re really asking: What’s your thought process? Are you an analytical thinker?

With this type of question (sometimes called a guesstimate), the interviewer presents you with a problem to solve. How would you estimate the best month to offer a discount on shoes? How would you estimate the weekly profit of your favorite restaurant?

The purpose here is to evaluate your problem-solving ability and overall comfort working with numbers. Since this is about how you think, think out loud as you work through your answer.

  • What types of data would you need?

  • Where might you find that data?

  • Once you have the data, how would you use it to calculate an estimate?

6. What is your process for cleaning data?

What they’re really asking: How do you handle missing data, outliers, duplicate data, etc.?

As a data analyst, data preparation, also known as data cleaning or data cleansing, will often account for the majority of your time. A potential employer will want to know that you’re familiar with the process and why it’s important.

In your answer, briefly describe what data cleaning is and why it’s important to the overall process. Then walk through the steps you typically take to clean a data set. Consider mentioning how you handle:

  • Missing data

  • Duplicate data

  • Data from different sources

  • Structural errors

  • Outliers

An interviewer might also ask:

  • How do you deal with messy data?

  • What is data cleaning?

7. How do you explain technical concepts to a non-technical audience?

What they’re really asking: How are your communication skills?

While drawing insights from data is a critical skill for a data analyst, communicating those insights to stakeholders, management, and non-technical co-workers is just as important. 

Your answer should include the types of audiences you’ve presented to in the past (size, background, context). If you don’t have a lot of experience presenting, you can still talk about how you’d present data findings differently depending on the audience. 

An interviewer might also ask:

  • What is your experience conducting presentations?

  • Why are communication skills important to a data analyst?

  • How do you present your findings to management?

Tip: In some cases, your interviewer might not be involved in data analysis. The entire interview, then, is an opportunity to demonstrate your ability to communicate clearly. Consider practicing your answers on a non-technical friend or family member.

Tip: In some cases, your interviewer might not be involved in data analysis. The entire interview, then, is an opportunity to demonstrate your ability to communicate clearly. Consider practicing your answers on a non-technical friend or family member.

8. Tell me about a time when you got unexpected results.

What they’re really asking: Do you let the data or your expectations drive your analysis?

Effective data analysts let the data tell the story. After all, data-driven decisions are based on facts rather than intuition or gut feelings. When asking this question, an interviewer might be trying to determine:

  • How you validate results to ensure accuracy

  • How you overcome selection bias

  • If you’re able to find new business opportunities in surprising results

Be sure to describe the situation that surprised you and what you learned from it. This is your opportunity to demonstrate your natural curiosity and excitement to learn new things from data.

9. How would you go about measuring the performance of our company?

What they’re really asking: Have you done your research?

Before your interview, be sure to do some research on the company, its business goals, and the larger industry. Think about the types of business problems that could be solved through data analysis, and what types of data you’d need to perform that analysis. Read up on how data is used by competitors and in the industry.

Show that you can be business-minded by tying this back to the company. How would this analysis bring value to their business?

Technical skill questions

Interviewers will be looking for candidates who can leverage a wide range of technical data analyst skills. These questions are geared toward evaluating your competency across several skills.

10. What data analytics software are you familiar with?

What they’re really asking: Do you have basic competency with common tools? How much training will you need?

This is a good time to revisit the job listing to look for any software emphasized in the description. As you answer, explain how you’ve used that software (or something similar) in the past. Show your familiarity with the tool by using associated terminology.

Mention software solutions you’ve used for various stages of the data analysis process. You don’t need to go into great detail here. What you used and what you used it for should suffice.

An interviewer might also ask:

  • What data software have you used in the past?

  • What data analytics software are you trained in?


Tip: Gain experience with data analytics software through a Guided Project on Coursera. Get hands-on learning in under two hours, without having to download or purchase software. You’ll be ready with something to talk about during your next interview for analysis tools like:

R

Power BI Desktop

Python

Google Sheets

Tableau

Microsoft Excel

MySQL


11. What scripting languages are you trained in?

As a data analyst, you’ll likely have to use SQL and a statistical programming language like R or Python. If you’re already familiar with the language of choice at the company, you’re applying to, great. If not, you can take this time to show enthusiasm for learning. Point out that your experience with one (or more) languages has set you up for success in learning new ones. Talk about how you’re currently growing your skills.

Interviewer might also ask:

  • What functions in SQL do you like most?

  • Do you prefer R or Python?


Five SQL interview questions for data analysts

Knowledge of SQL is one of the most important skills you can have as a data analyst. Many interviews for data analyst jobs include an SQL screening where you’ll be asked to write code on a computer or whiteboard. Here are five SQL questions and tasks to prepare for:

1. Create an SQL query: Be ready to use JOIN and COUNT functions to show a query result from a given database.

2. Describe an SQL query: Given an SQL query, explain what data is being retrieved.

3. Modify a database: Insert new rows, modify existing records, or permanently delete records from a database.

4. Debug a query: Correct the errors in an existing query to make it functional.

5. Define an SQL term: Understand what terms like foreign and primary key, truncate, drop, union, union all, and left join and inner join mean (and when you’d use them).


12. What statistical methods have you used in data analysis?

What they’re really asking: Do you have basic statistical knowledge?

Most entry-level data analyst roles will require at least a basic competency in statistics and an understanding of how statistical analysis ties into business goals. List the types of statistical calculations you’ve used in the past and what business insights those calculations yielded. 

If you’ve ever worked with or created statistical models, be sure to mention that as well. If you’re not already, familiarize yourself with the following statistical concepts:

  • Mean

  • Standard deviation

  • Variance

  • Regression

  • Sample size

  • Descriptive and inferential statistics

An interviewer might also ask:

  • What is your knowledge of statistics?

  • How have you used statistics in your work as a data analyst?

13. How have you used Excel for data analysis in the past?

Spreadsheets rank among the most common tools used by data analysts. It’s common for interviews to include one or more questions meant to gauge your skill working with data in Microsoft Excel. 


Five Excel interview questions for data analysts

Here are five more questions specific to Excel that you might be asked during your interview:

1. What is a VLOOKUP, and what are its limitations?

2. What is a pivot table, and how do you make one?

3. How do you find and remove duplicate data?

4. What are INDEX and MATCH functions, and how do they work together?

5. What’s the difference between a function and a formula?


14. Explain the term…

What they’re really asking: Are you familiar with the terminology of data analytics?

Throughout your interview, you may be asked to define a term or explain what it means. In most cases, the interviewer is trying to determine how well you know the field and how effective you are at communicating technical concepts in simple terms. While it’s impossible to know what exact terms you may be asked about, here are a few you should be familiar with:

  • Normal distribution

  • Data wrangling

  • KNN imputation method

  • Clustering

  • Outlier

  • N-grams

  • Statistical model

15. Can you describe the difference between … ?

Similar to the last type of question, these interview questions help determine your knowledge of analytics concepts by asking you to compare two related terms. Some pairs you might want to be familiar with include:

  • Data mining vs. data profiling

  • Quantitative vs. qualitative data

  • Variance vs. covariance

  • Univariate vs. bivariate vs. multivariate analysis

  • Clustered vs. non-clustered index

  • 1-sample T-test vs. 2-sample T-test in SQL

  • Joining vs. blending in Tableau

The final question: Do you have any questions?

Almost every interview, regardless of field, ends with some variation of this question. This process is about you evaluating the company as much as it is about the company evaluating you. Come prepared with a few questions for your interviewer, but don’t be afraid to ask any questions that came up during the interview as well. Some topics you can ask about include:

  • What a typical day is like

  • Expectations for your first 90 days

  • Company culture and goals

  • Your potential team and manager

  • The interviewer’s favorite part about the company


Testgorilla: data-analyst-interview-questions

Tuesday 12 July 2022

Consultancy Work Template for an Internet Based Service Company

Discover the company data base

  1. Query of the raw DB tables
  2. Find out if there is a Primary Key for each table 
  3. Find out if there is a Meta Data table
  4. Try to draw the Relation Diagram
  5. Don't leave any of the fields unnamed and no meta data entry
  6. Try to find out data patterns
  7. Try to locate any faulty data or blanks in the data (imputation)
  8. Use WEKA
  9. Use KNIME
  10. Data warehouse design

Sunday 19 June 2022

An Exhaustive Treatment of the Waikato Environment for Knowledge Analysis (WEKA)

This is an exhaustive thread to analyse the WEKA (Waikato Environment for Knowledge Analysis). Various sources will be used both with and without reference. As this is just for educational purposes please don't use it as a source or give a link to it.


Below is the 


from the Uni of Waikato


Below is a mini tutorial from  www.tutorialspoint.com


WEKA


Weka is a comprehensive software that lets you to preprocess the big data, apply different machine learning algorithms on big data and compare various outputs. This software makes it easy to work with big data and train a machine using machine learning algorithms.
 

Weka - Introduction


The foundation of any Machine Learning application is data - not just a little data but a huge data which is termed as Big Data in the current terminology.

To train the machine to analyze big data, you need to have several considerations on the data −

  • The data must be clean.
  • It should not contain null values.

Besides, not all the columns in the data table would be useful for the type of analytics that you are trying to achieve. The irrelevant data columns or ‘features’ as termed in Machine Learning terminology, must be removed before the data is fed into a machine learning algorithm.

In short, your big data needs lots of preprocessing before it can be used for Machine Learning. Once the data is ready, you would apply various Machine Learning algorithms such as classification, regression, clustering and so on to solve the problem at your end.

The type of algorithms that you apply is based largely on your domain knowledge. Even within the same type, for example classification, there are several algorithms available. You may like to test the different algorithms under the same class to build an efficient machine learning model. While doing so, you would prefer visualization of the processed data and thus you also require visualization tools.

In the upcoming chapters, you will learn about Weka, a software that accomplishes all the above with ease and lets you work with big data comfortably.


What is Weka?


WEKA - an open source software provides tools for data preprocessing, implementation of several Machine Learning algorithms, and visualization tools so that you can develop machine learning techniques and apply them to real-world data mining problems. What WEKA offers is summarized in the following diagram −

Weka Summarized

If you observe the beginning of the flow of the image, you will understand that there are many stages in dealing with Big Data to make it suitable for machine learning −

First, you will start with the raw data collected from the field. This data may contain several null values and irrelevant fields. You use the data preprocessing tools provided in WEKA to cleanse the data.

Then, you would save the preprocessed data in your local storage for applying ML algorithms.

Next, depending on the kind of ML model that you are trying to develop you would select one of the options such as Classify, Cluster, or Associate. The Attributes Selection allows the automatic selection of features to create a reduced dataset.

Note that under each category, WEKA provides the implementation of several algorithms. You would select an algorithm of your choice, set the desired parameters and run it on the dataset.

Then, WEKA would give you the statistical output of the model processing. It provides you a visualization tool to inspect the data.

The various models can be applied on the same dataset. You can then compare the outputs of different models and select the best that meets your purpose.

Thus, the use of WEKA results in a quicker development of machine learning models on the whole.

Now that we have seen what WEKA is and what it does, in the next chapter let us learn how to install WEKA on your local computer.


Weka - Launching Explorer


In this chapter, let us look into various functionalities that the explorer provides for working with big data.

When you click on the Explorer button in the Applications selector, it opens the following screen −

Explorer Button

On the top, you will see several tabs as listed here −

  • Preprocess
  • Classify
  • Cluster
  • Associate
  • Select Attributes
  • Visualize

Under these tabs, there are several pre-implemented machine learning algorithms. Let us look into each of them in detail now.

Preprocess Tab

Initially as you open the explorer, only the Preprocess tab is enabled. The first step in machine learning is to preprocess the data. Thus, in the Preprocess option, you will select the data file, process it and make it fit for applying the various machine learning algorithms.

Classify Tab

The Classify tab provides you several machine learning algorithms for the classification of your data. To list a few, you may apply algorithms such as Linear Regression, Logistic Regression, Support Vector Machines, Decision Trees, RandomTree, RandomForest, NaiveBayes, and so on. The list is very exhaustive and provides both supervised and unsupervised machine learning algorithms.

Cluster Tab

Under the Cluster tab, there are several clustering algorithms provided - such as SimpleKMeans, FilteredClusterer, HierarchicalClusterer, and so on.

Associate Tab

Under the Associate tab, you would find Apriori, FilteredAssociator and FPGrowth.

Select Attributes Tab

Select Attributes allows you feature selections based on several algorithms such as ClassifierSubsetEval, PrinicipalComponents, etc.

Visualize Tab

Lastly, the Visualize option allows you to visualize your processed data for analysis.

As you noticed, WEKA provides several ready-to-use algorithms for testing and building your machine learning applications. To use WEKA effectively, you must have a sound knowledge of these algorithms, how they work, which one to choose under what circumstances, what to look for in their processed output, and so on. In short, you must have a solid foundation in machine learning to use WEKA effectively in building your apps.

In the upcoming chapters, you will study each tab in the explorer in depth.


Weka - Loading Data

In this chapter, we start with the first tab that you use to preprocess the data. This is common to all algorithms that you would apply to your data for building the model and is a common step for all subsequent operations in WEKA.

For a machine learning algorithm to give acceptable accuracy, it is important that you must cleanse your data first. This is because the raw data collected from the field may contain null values, irrelevant columns and so on.

In this chapter, you will learn how to preprocess the raw data and create a clean, meaningful dataset for further use.

First, you will learn to load the data file into the WEKA explorer. The data can be loaded from the following sources −

  • Local file system
  • Web
  • Database

In this chapter, we will see all the three options of loading data in detail.

Loading Data from Local File System

Just under the Machine Learning tabs that you studied in the previous lesson, you would find the following three buttons −

  • Open file ...
  • Open URL ...
  • Open DB ...

Click on the Open file ... button. A directory navigator window opens as shown in the following screen −

Local File System

Now, navigate to the folder where your data files are stored. WEKA installation comes up with many sample databases for you to experiment. These are available in the data folder of the WEKA installation.

For learning purpose, select any data file from this folder. The contents of the file would be loaded in the WEKA environment. We will very soon learn how to inspect and process this loaded data. Before that, let us look at how to load the data file from the Web.

Loading Data from Web

Once you click on the Open URL ... button, you can see a window as follows −

Loading Data From Web

We will open the file from a public URL Type the following URL in the popup box −

https://storm.cis.fordham.edu/~gweiss/data-mining/weka-data/weather.nominal.arff

You may specify any other URL where your data is stored. The Explorer will load the data from the remote site into its environment.

Loading Data from DB

Once you click on the Open DB ... button, you can see a window as follows −

Loading Data From Db

Set the connection string to your database, set up the query for data selection, process the query and load the selected records in WEKA.


Weka - File Formats


WEKA supports a large number of file formats for the data. Here is the complete list −

  • arff
  • arff.gz
  • bsi
  • csv
  • dat
  • data
  • json
  • json.gz
  • libsvm
  • m
  • names
  • xrff
  • xrff.gz

The types of files that it supports are listed in the drop-down list box at the bottom of the screen. This is shown in the screenshot given below.

Drop Down List

As you would notice it supports several formats including CSV and JSON. The default file type is Arff.

Arff Format

An Arff file contains two sections - header and data.

  • The header describes the attribute types.
  • The data section contains a comma separated list of data.

As an example for Arff format, the Weather data file loaded from the WEKA sample databases is shown below −

Sample Databases

From the screenshot, you can infer the following points −

  • The @relation tag defines the name of the database.

  • The @attribute tag defines the attributes.

  • The @data tag starts the list of data rows each containing the comma separated fields.

  • The attributes can take nominal values as in the case of outlook shown here −

@attribute outlook (sunny, overcast, rainy)
  • The attributes can take real values as in this case −

@attribute temperature real
  • You can also set a Target or a Class variable called play as shown here −

@attribute play (yes, no)
  • The Target assumes two nominal values yes or no.

Other Formats

The Explorer can load the data in any of the earlier mentioned formats. As arff is the preferred format in WEKA, you may load the data from any format and save it to arff format for later use. After preprocessing the data, just save it to arff format for further analysis.

Now that you have learned how to load data into WEKA, in the next chapter, you will learn how to preprocess the data.


Weka - Preprocessing the Data


The data that is collected from the field contains many unwanted things that leads to wrong analysis. For example, the data may contain null fields, it may contain columns that are irrelevant to the current analysis, and so on. Thus, the data must be preprocessed to meet the requirements of the type of analysis you are seeking. This is the done in the preprocessing module.

To demonstrate the available features in preprocessing, we will use the Weather database that is provided in the installation.

Using the Open file ... option under the Preprocess tag select the weather-nominal.arff file.

Weather Nominal

When you open the file, your screen looks like as shown here −

Weka Explore

This screen tells us several things about the loaded data, which are discussed further in this chapter.

Understanding Data

Let us first look at the highlighted Current relation sub window. It shows the name of the database that is currently loaded. You can infer two points from this sub window −

  • There are 14 instances - the number of rows in the table.

  • The table contains 5 attributes - the fields, which are discussed in the upcoming sections.

On the left side, notice the Attributes sub window that displays the various fields in the database.

Weka Attributes

The weather database contains five fields - outlook, temperature, humidity, windy and play. When you select an attribute from this list by clicking on it, further details on the attribute itself are displayed on the right hand side.

Let us select the temperature attribute first. When you click on it, you would see the following screen −

Temperature Attribute

In the Selected Attribute subwindow, you can observe the following −

  • The name and the type of the attribute are displayed.

  • The type for the temperature attribute is Nominal.

  • The number of Missing values is zero.

  • There are three distinct values with no unique value.

  • The table underneath this information shows the nominal values for this field as hot, mild and cold.

  • It also shows the count and weight in terms of a percentage for each nominal value.

At the bottom of the window, you see the visual representation of the class values.

If you click on the Visualize All button, you will be able to see all features in one single window as shown here −

Visualize All

Removing Attributes

Many a time, the data that you want to use for model building comes with many irrelevant fields. For example, the customer database may contain his mobile number which is relevant in analysing his credit rating.

Removing Attributes

To remove Attribute/s select them and click on the Remove button at the bottom.

The selected attributes would be removed from the database. After you fully preprocess the data, you can save it for model building.

Next, you will learn to preprocess the data by applying filters on this data.

Applying Filters

Some of the machine learning techniques such as association rule mining requires categorical data. To illustrate the use of filters, we will use weather-numeric.arff database that contains two numeric attributes - temperature and humidity.

We will convert these to nominal by applying a filter on our raw data. Click on the Choose button in the Filter subwindow and select the following filter −

weka→filters→supervised→attribute→Discretize

Weka Discretize

Click on the Apply button and examine the temperature and/or humidity attribute. You will notice that these have changed from numeric to nominal types.

Humidity Attribute

Let us look into another filter now. Suppose you want to select the best attributes for deciding the play. Select and apply the following filter −

weka→filters→supervised→attribute→AttributeSelection

You will notice that it removes the temperature and humidity attributes from the database.

Weka Attribute Selection

After you are satisfied with the preprocessing of your data, save the data by clicking the Save ... button. You will use this saved file for model building.

In the next chapter, we will explore the model building using several predefined ML algorithms.


Weka - Classifiers


Many machine learning applications are classification related. For example, you may like to classify a tumor as malignant or benign. You may like to decide whether to play an outside game depending on the weather conditions. Generally, this decision is dependent on several features/conditions of the weather. So you may prefer to use a tree classifier to make your decision of whether to play or not.

In this chapter, we will learn how to build such a tree classifier on weather data to decide on the playing conditions.

Setting Test Data

We will use the preprocessed weather data file from the previous lesson. Open the saved file by using the Open file ... option under the Preprocess tab, click on the Classify tab, and you would see the following screen −

Classify Tab

Before you learn about the available classifiers, let us examine the Test options. You will notice four testing options as listed below −

  • Training set
  • Supplied test set
  • Cross-validation
  • Percentage split

Unless you have your own training set or a client supplied test set, you would use cross-validation or percentage split options. Under cross-validation, you can set the number of folds in which entire data would be split and used during each iteration of training. In the percentage split, you will split the data between training and testing using the set split percentage.

Now, keep the default play option for the output class −

Play Option

Next, you will select the classifier.

Selecting Classifier

Click on the Choose button and select the following classifier −

weka→classifiers>trees>J48

This is shown in the screenshot below −

Weka Trees

Click on the Start button to start the classification process. After a while, the classification results would be presented on your screen as shown here −

Start Button

Let us examine the output shown on the right hand side of the screen.

It says the size of the tree is 6. You will very shortly see the visual representation of the tree. In the Summary, it says that the correctly classified instances as 2 and the incorrectly classified instances as 3, It also says that the Relative absolute error is 110%. It also shows the Confusion Matrix. Going into the analysis of these results is beyond the scope of this tutorial. However, you can easily make out from these results that the classification is not acceptable and you will need more data for analysis, to refine your features selection, rebuild the model and so on until you are satisfied with the model’s accuracy. Anyway, that’s what WEKA is all about. It allows you to test your ideas quickly.

Visualize Results

To see the visual representation of the results, right click on the result in the Result list box. Several options would pop up on the screen as shown here −

Result List

Select Visualize tree to get a visual representation of the traversal tree as seen in the screenshot below −

Visualize Tree

Selecting Visualize classifier errors would plot the results of classification as shown here −

Classifier Errors

A cross represents a correctly classified instance while squares represents incorrectly classified instances. At the lower left corner of the plot you see a cross that indicates if outlook is sunny then play the game. So this is a correctly classified instance. To locate instances, you can introduce some jitter in it by sliding the jitter slide bar.

The current plot is outlook versus play. These are indicated by the two drop down list boxes at the top of the screen.

Outlook Versus Play

Now, try a different selection in each of these boxes and notice how the X & Y axes change. The same can be achieved by using the horizontal strips on the right hand side of the plot. Each strip represents an attribute. Left click on the strip sets the selected attribute on the X-axis while a right click would set it on the Y-axis.

There are several other plots provided for your deeper analysis. Use them judiciously to fine tune your model. One such plot of Cost/Benefit analysis is shown below for your quick reference.

Cost Benefit Analysis

Explaining the analysis in these charts is beyond the scope of this tutorial. The reader is encouraged to brush up their knowledge of analysis of machine learning algorithms.

In the next chapter, we will learn the next set of machine learning algorithms, that is clustering.


Weka - Clustering


A clustering algorithm finds groups of similar instances in the entire dataset. WEKA supports several clustering algorithms such as EM, FilteredClusterer, HierarchicalClusterer, SimpleKMeans and so on. You should understand these algorithms completely to fully exploit the WEKA capabilities.

As in the case of classification, WEKA allows you to visualize the detected clusters graphically. To demonstrate the clustering, we will use the provided iris database. The data set contains three classes of 50 instances each. Each class refers to a type of iris plant.

Loading Data

In the WEKA explorer select the Preprocess tab. Click on the Open file ... option and select the iris.arff file in the file selection dialog. When you load the data, the screen looks like as shown below −

Screen Looks

You can observe that there are 150 instances and 5 attributes. The names of attributes are listed as sepallength, sepalwidth, petallength, petalwidth and class. The first four attributes are of numeric type while the class is a nominal type with 3 distinct values. Examine each attribute to understand the features of the database. We will not do any preprocessing on this data and straight-away proceed to model building.

Clustering

Click on the Cluster TAB to apply the clustering algorithms to our loaded data. Click on the Choose button. You will see the following screen −

Cluster Tab

Now, select EM as the clustering algorithm. In the Cluster mode sub window, select the Classes to clusters evaluation option as shown in the screenshot below −

Clustering Algorithm

Click on the Start button to process the data. After a while, the results will be presented on the screen.

Next, let us study the results.

Examining Output

The output of the data processing is shown in the screen below −

Examining Output

From the output screen, you can observe that −

  • There are 5 clustered instances detected in the database.

  • The Cluster 0 represents setosa, Cluster 1 represents virginica, Cluster 2 represents versicolor, while the last two clusters do not have any class associated with them.

If you scroll up the output window, you will also see some statistics that gives the mean and standard deviation for each of the attributes in the various detected clusters. This is shown in the screenshot given below −

Detected Clusters

Next, we will look at the visual representation of the clusters.

Visualizing Clusters

To visualize the clusters, right click on the EM result in the Result list. You will see the following options −

Clusters Result List

Select Visualize cluster assignments. You will see the following output −

Cluster Assignments

As in the case of classification, you will notice the distinction between the correctly and incorrectly identified instances. You can play around by changing the X and Y axes to analyze the results. You may use jittering as in the case of classification to find out the concentration of correctly identified instances. The operations in visualization plot are similar to the one you studied in the case of classification.

Applying Hierarchical Clusterer

To demonstrate the power of WEKA, let us now look into an application of another clustering algorithm. In the WEKA explorer, select the HierarchicalClusterer as your ML algorithm as shown in the screenshot shown below −

Hierarchical Clusterer

Choose the Cluster mode selection to Classes to cluster evaluation, and click on the Start button. You will see the following output −

Cluster Evaluation

Notice that in the Result list, there are two results listed: the first one is the EM result and the second one is the current Hierarchical. Likewise, you can apply multiple ML algorithms to the same dataset and quickly compare their results.

If you examine the tree produced by this algorithm, you will see the following output −

Examine Algorithm

In the next chapter, you will study the Associate type of ML algorithms.


Weka - Association


It was observed that people who buy beer also buy diapers at the same time. That is there is an association in buying beer and diapers together. Though this seems not well convincing, this association rule was mined from huge databases of supermarkets. Similarly, an association may be found between peanut butter and bread.

Finding such associations becomes vital for supermarkets as they would stock diapers next to beers so that customers can locate both items easily resulting in an increased sale for the supermarket.

The Apriori algorithm is one such algorithm in ML that finds out the probable associations and creates association rules. WEKA provides the implementation of the Apriori algorithm. You can define the minimum support and an acceptable confidence level while computing these rules. You will apply the Apriori algorithm to the supermarket data provided in the WEKA installation.

Loading Data

In the WEKA explorer, open the Preprocess tab, click on the Open file ... button and select supermarket.arff database from the installation folder. After the data is loaded you will see the following screen −

Loading Data

The database contains 4627 instances and 217 attributes. You can easily understand how difficult it would be to detect the association between such a large number of attributes. Fortunately, this task is automated with the help of Apriori algorithm.

Associator

Click on the Associate TAB and click on the Choose button. Select the Apriori association as shown in the screenshot −

Associate Tab

To set the parameters for the Apriori algorithm, click on its name, a window will pop up as shown below that allows you to set the parameters −

Apriori Algorithm

After you set the parameters, click the Start button. After a while you will see the results as shown in the screenshot below −

Start Parameters

At the bottom, you will find the detected best rules of associations. This will help the supermarket in stocking their products in appropriate shelves.


Weka - Feature Selection


When a database contains a large number of attributes, there will be several attributes which do not become significant in the analysis that you are currently seeking. Thus, removing the unwanted attributes from the dataset becomes an important task in developing a good machine learning model.

You may examine the entire dataset visually and decide on the irrelevant attributes. This could be a huge task for databases containing a large number of attributes like the supermarket case that you saw in an earlier lesson. Fortunately, WEKA provides an automated tool for feature selection.

This chapter demonstrate this feature on a database containing a large number of attributes.

Loading Data

In the Preprocess tag of the WEKA explorer, select the labor.arff file for loading into the system. When you load the data, you will see the following screen −

Loading Data

Notice that there are 17 attributes. Our task is to create a reduced dataset by eliminating some of the attributes which are irrelevant to our analysis.

Features Extraction

Click on the Select attributesTAB.You will see the following screen −

Select Attributes

Under the Attribute Evaluator and Search Method, you will find several options. We will just use the defaults here. In the Attribute Selection Mode, use full training set option.

Click on the Start button to process the dataset. You will see the following output −

Start Dataset

At the bottom of the result window, you will get the list of Selected attributes. To get the visual representation, right click on the result in the Result list.

The output is shown in the following screenshot −

Screenshot Output

Clicking on any of the squares will give you the data plot for your further analysis. A typical data plot is shown below −

Data Plot

This is similar to the ones we have seen in the earlier chapters. Play around with the different options available to analyze the results.

What’s Next?

You have seen so far the power of WEKA in quickly developing machine learning models. What we used is a graphical tool called Explorer for developing these models. WEKA also provides a command line interface that gives you more power than provided in the explorer.

Clicking the Simple CLI button in the GUI Chooser application starts this command line interface which is shown in the screenshot below −

Gui Chooser

Type your commands in the input box at the bottom. You will be able to do all that you have done so far in the explorer plus much more. Refer to WEKA documentation (https://www.cs.waikato.ac.nz/ml/weka/documentation.html) for further details.

Lastly, WEKA is developed in Java and provides an interface to its API. So if you are a Java developer and keen to include WEKA ML implementations in your own Java projects, you can do so easily.

Conclusion

WEKA is a powerful tool for developing machine learning models. It provides implementation of several most widely used ML algorithms. Before these algorithms are applied to your dataset, it also allows you to preprocess the data. The types of algorithms that are supported are classified under Classify, Cluster, Associate, and Select attributes. The result at various stages of processing can be visualized with a beautiful and powerful visual representation. This makes it easier for a Data Scientist to quickly apply the various machine learning techniques on his dataset, compare the results and create the best model for the final use.